
It has become easier to produce customised graphics in SAS and to produce reports that combine outputs from several different procedures. This means that refined outputs can be produced that allow more targeted monitoring of individual patients and populations of patients.
Customized Graphics
There is now a range of graphical elements that allow graphs in SAS to easily convey a range of information for the user to see several concepts at one time all in one picture.
This example shows a small subset of the graphical elements available.
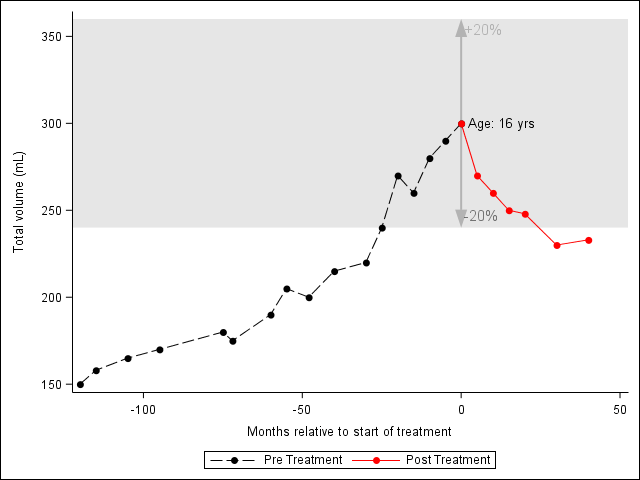
In this case the user can quickly see several concepts of a subject’s results over time:
- Pre and post treatment performance
- How the performance in those periods is relative to a band of interest
- The width of the band as a percentage of the result at time of treatment (0 month)
- Subject’s age at treatment
This graph is produced using PROC SGPLOT with the use of annotation dataset and statements within the PROC SGPLOT itself.
The text in the body of the graph comes from using the annotation and the position of these is data driven and will automatically change between subject. As well the arrow showing the width of the band was created with the new annotation function “arrow”.
The grey band comes from the band statement in PROC SGPLOT.
When designing a graph like this it is important to spend time talking to the user to find out how they go about making decisions from the study information. In particular what different pieces of information that contribute to the decision. Often they may take this information from many sources (e.g. existing graphs, tabular output, online reference).
Once you have a clearer understanding of this it is usually possible to design a graphical output that combines all this information in a way that the user can quickly see the information needed and the relationships between the various pieces of information.
Combining Outputs
Putting all the information needed for decision making on one page should not be restricted solely to graphical output from SAS. It is very simple now to combine tabular, graphics and user text and to position them anywhere you want on a page.
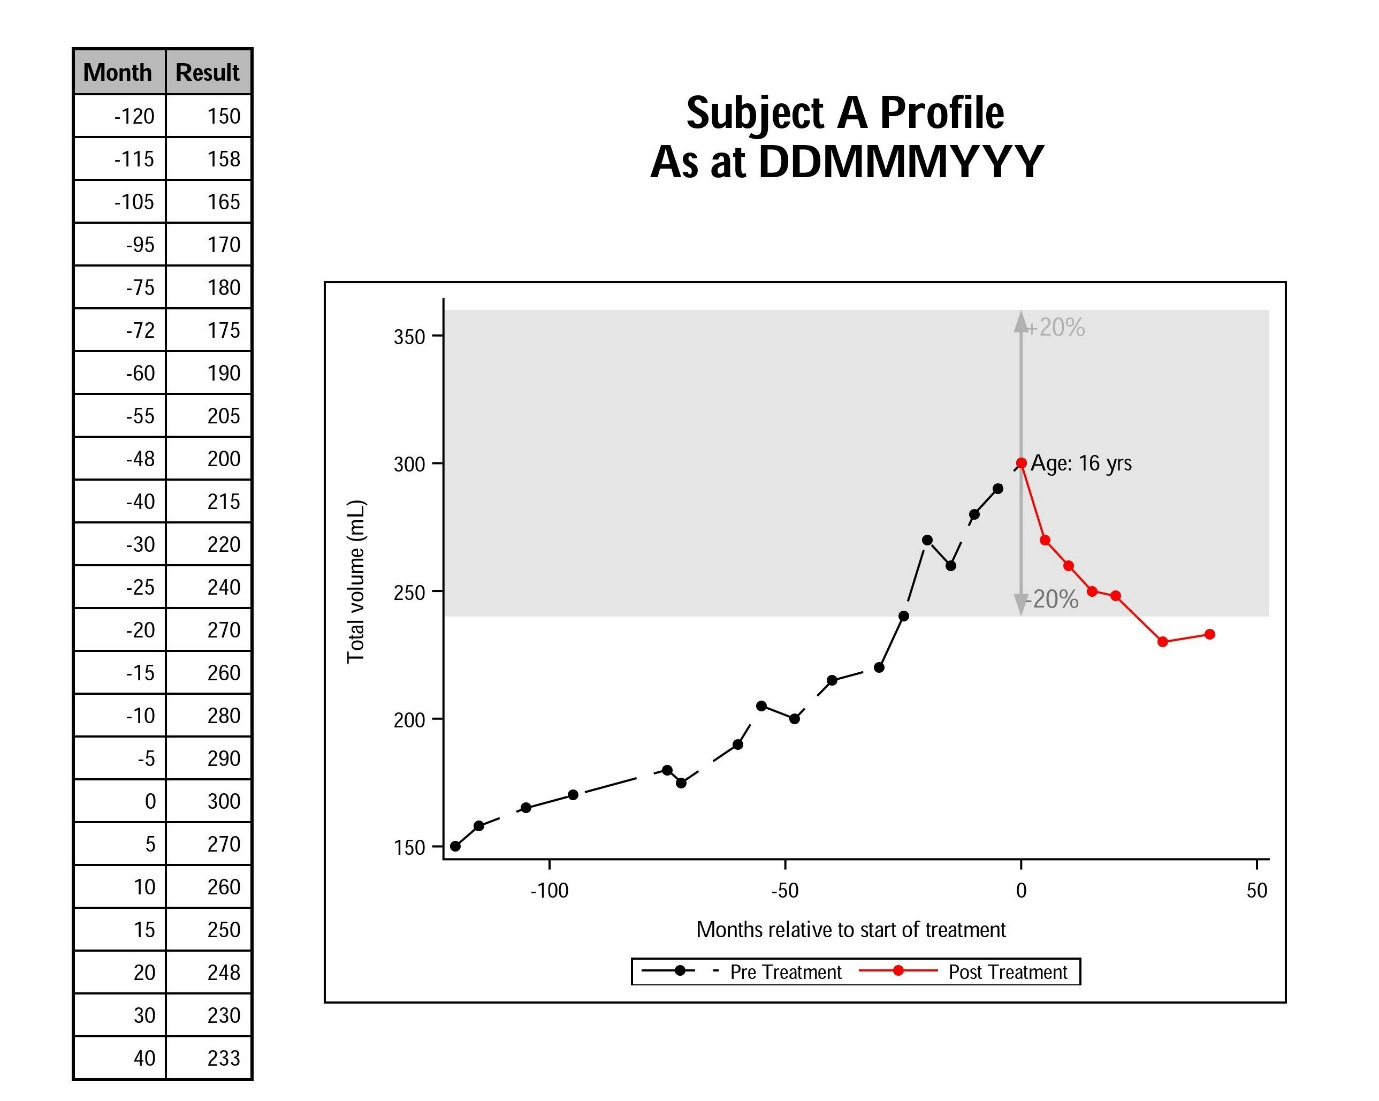
The example above shows an example of what can be done using SAS ODS functionality. Using ODS LAYOUT and ODS REGION you can divide the page up into regions where output from SAS procedures will be directed. Below is some snippets of code which shows how this is done.
ods layout start width=8.49in height=8in;
ods region x = 2 in y = 1.95 in width = 6 in height = 6 in;
proc sgplot for graph on right
ods region x = 0 in y = 0.5 in width = 2 in height = 7.5 in;
proc report for table on left
ods region x = 2.5 in y = 0.75 in width = 5.5 in height = 1 in;
ods text for title